Last Updated on May 22, 2022 by Mary Pressler
Solar Power, LED Lighting and HVAC Upgrades: A Promising Combination for Commercial Buildings
The US building sector is responsible for 40% of total energy consumption and GHG emissions. However, there is a significant opportunity to improve energy performance in commercial properties. Energy efficiency upgrades and onsite renewable generation have financial and environmental benefits – they reduce both energy bills and emissions.
Each building is unique, and only an energy audit can determine the most effective measures to save electricity and gas. However, HVAC systems are the largest load in most commercial buildings, followed by lighting.
In the 2020 ACEEE Scorecard, New York was ranked as America’s most energy efficient city. This has been possible in great part thanks to energy benchmarking, which is required by law for all buildings larger than 25,000 square feet. The benchmarking results have revealed a snapshot of how energy consumption is distributed:
- HVAC is the largest load, representing 47% of energy consumption.
- Lighting loads were second, representing 18% of energy consumption.
While these results are specific for NYC, they provide an example of how much energy is used for HVAC and lighting. To maximize their energy savings, building owners can focus on upgrading these systems first.
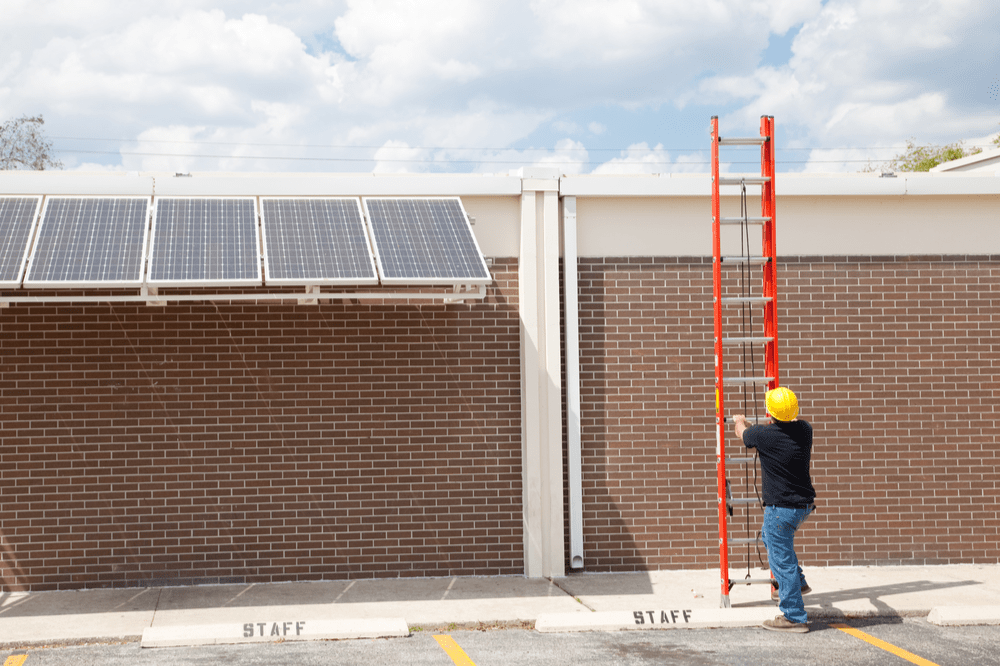
Solar power is also a promising upgrade for commercial buildings. Thanks to their modular design, solar panels can adapt to different roof structures and building sizes. In addition, the US Congress extended the Investment Tax Credit for two years in December 2020, giving a 26% credit for all commercial solar arrays that start construction in 2021 and 2022.
Read on, or jump ahead:
Financial Performance of a Commercial Solar Power System
The electricity production of solar panels is determined by site conditions, especially the amount of sunlight and the presence of obstacles that cast shadows. However, the exact savings are determined by kilowatt-hour prices – solar generation is more valuable in places with expensive electricity, such as California and the New England states.
This section will provide a general analysis of solar power costs and savings, based on typical system costs reported by the National Renewable Energy Laboratory, and considering the 26% tax credit. The calculation also assumes an electricity price of 16 cents/kWh (US EIA), which is typical for commercial buildings in states that are top markets for solar power.
- According to the latest annual data from the NREL, a commercial rooftop PV system has a typical cost of $1.72 per watt.
- For a 200-kW array, the installed cost would be around $344,000 million
With favorable sunlight conditions, each kilowatt of installed solar capacity can deliver more than 1,500 kWh/year. For a 200-kW system, the production would be 300,000 kWh/year, which has a value of $48,000/year at 16 cents/kWh.
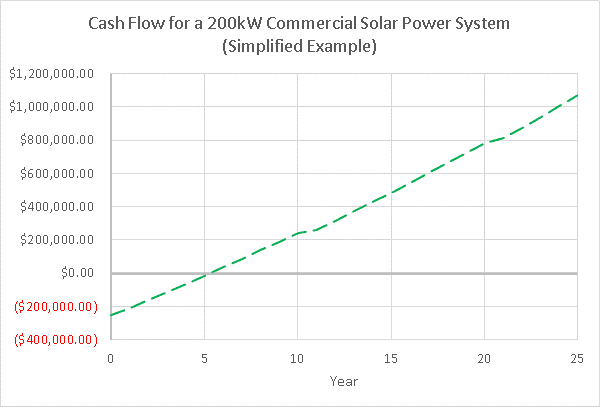
With the 26% federal tax credit, the net cost of the system becomes $254,560, and the simple payback period is 5.3 years. However, when state-level incentives are considered, this can be reduced to less than 3 years in some cases. Considering that quality solar panels last for over 25 years, the payback period is just a small fraction of their service life.
The following is a simplified cash flow projection for this project. Note how it breaks even shortly after five years, accumulating over $1 million in savings by then end of year 25:
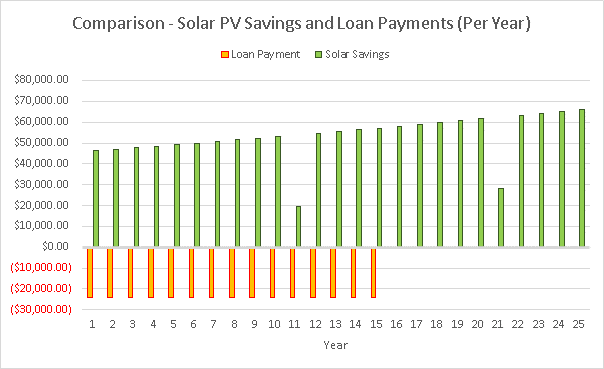
An instant payback period may be possible when solar power is financed with a low-interest loan. As long as monthly savings are higher than loan payments, the solar installation can cover its own cost.
- At 5% interest and with a term of 15 years results, a $254,560 loan results in a monthly payment of $2,013, or $24,156 per year.
- Since the 200-kW solar installation saves $48,000 in the first year, positive cash flow is reached immediately. In this example, the net savings for year one are $23,844.
- The savings are reduced slightly due to interest payments, but loan financing gives companies the option of going solar for $0 upfront.
The following graph compares the annual loan payments and savings. Note how the savings generated are higher than the loan payment starting from year one. Savings are lower on year 11 and year 21, since the cost of replacing the solar inverters is subtracted – unlike solar panels, which last for 25 years or more, inverters have a typical service life of 10 years.
Note: This is a very simplified example, since an actual solar project requires a site assessment and a detailed design. There are also maintenance and insurance costs over time, but they are small compared with the savings.
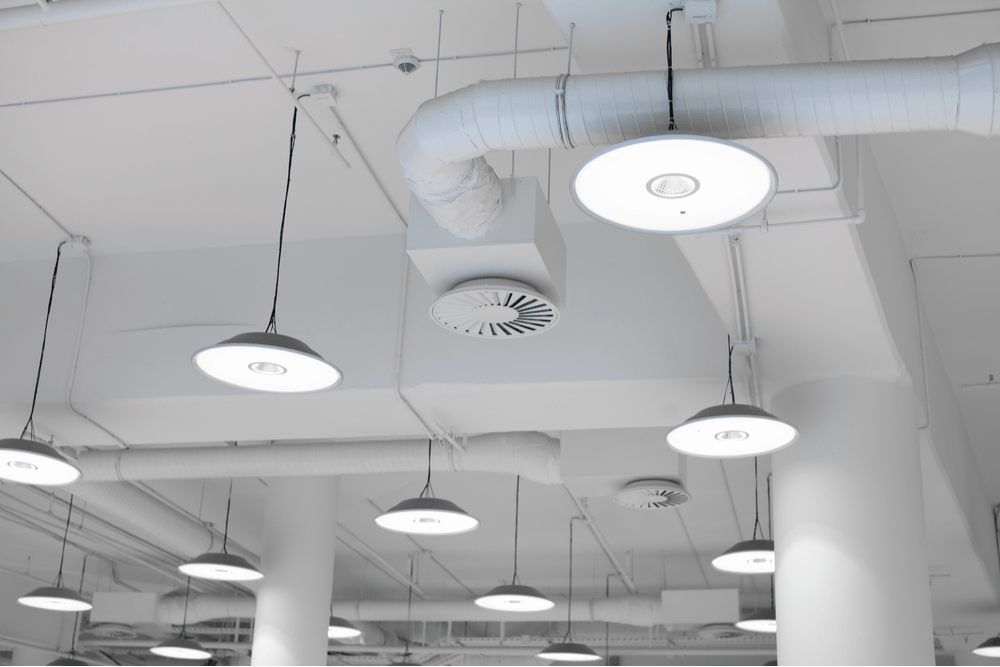
Financial Performance of an LED Lighting Upgrade
LED lighting is one of the most common upgrades recommended by energy consultants. Compared with other energy-saving measures, lighting upgrades can be completed quickly and with relative ease. The typical payback period of LED lighting is less than three years, and high quality products normally come with five-year warranties. In other words, the return on investment is guaranteed.
The costs and savings of a lighting upgrade can vary, depending on factors like the products used and local incentives. However, the following are typical costs of some common LED upgrades:
- 150W HID fixture = $150 per fixture
- 3xT8 4ft fluorescent lighting = $40 for a three-lamp fixture
- 100W flush-mounted ceiling lights = $100 per fixture
- 250W HID wall pack replacement = $200 per fixture
- 2xT8 8ft fluorescent = $100 for a two-lamp fixture (replaced with 4 lamps, 4ft each)
Electricity savings of 60-70% are typical when upgrading HID lighting, and savings of 30-50% can be expected when upgrading fluorescent lighting. The following table estimates the typical savings when upgrading 100 lighting fixtures of each type mentioned above, considering 3,600 hours of use per year.
| LED Upgrade | Existing Wattage | New Wattage | kWh Savings per Year | Savings ($) per Year |
| HID fixture retrofit | 150W | 40W | 39,600 kWh | $6,336 |
| T8 4ft, 3-lamp retrofit | 3x32W = 96W | 3x18W = 54W | 15,120 kWh | $2,419 |
| Ceiling lights | 100W | 20W | 28,800 kWh | $4,608 |
| Wall packs | 250W | 50W | 72,000 kWh | $11,520 |
| T8 8ft, 2-lamp retrofit | 2x59W = 118W | 4x18W = 72W | 16,560 kWh | $2,650 |
Based on the upgrade costs assumed and the calculated savings, the payback period of each lighting upgrade would be the following:
| LED Upgrade
(100 Fixtures) |
Upgrade Cost ($) | Savings per Year ($) | Payback Period |
| HID fixture retrofit | $15,000 | $6,336 | 2.4 years |
| T8 4 ft, 3-lamp retrofit | $7,500 | $2,419 | 3.1 years |
| Ceiling lights | $10,000 | $4,608 | 2.2 years |
| Wall packs | $20,000 | $11,520 | 1.7 years |
| T8 8 ft, 2-lamp retrofit | $10,000 | $2,650 | 3.8 years |
If all five upgrades are considered a single project, the total cost is $62,500 and the savings are $27,533 per year. In this case, the combined payback period is 2.3 years.
Just like with solar panels, loan financing can reduce the upfront cost of an LED upgrade to $0. The savings will then be higher than the loan payments, and the lighting upgrade pays itself.
- Assuming a 5% interest loan with a term of 5 years, the annual payments add up to $14,153, while the savings are $27,533/year.
- In this case, you would get net savings of $13,380 at zero upfront cost.
The savings of LED lighting go beyond electricity consumption. Commercial LED lamps have a typical service life of 50,000 – 100,000 years, which means you will also save many lamp replacements over time. Consider that HID bulbs last around 10,000 hours, while fluorescent tubes last for around 20,000 hours.
Additional savings are achieved when using LED lighting in air conditioned spaces. Since LEDs emit less heat than older lamp types, the space cooling load is also reduced. For example, if you replace 1,000 linear fluorescent fixtures (96W each) with 50W LED flat panels, you’re removing 46,000 watts from the building interior. This reduces the air conditioning load by around 13 tons.
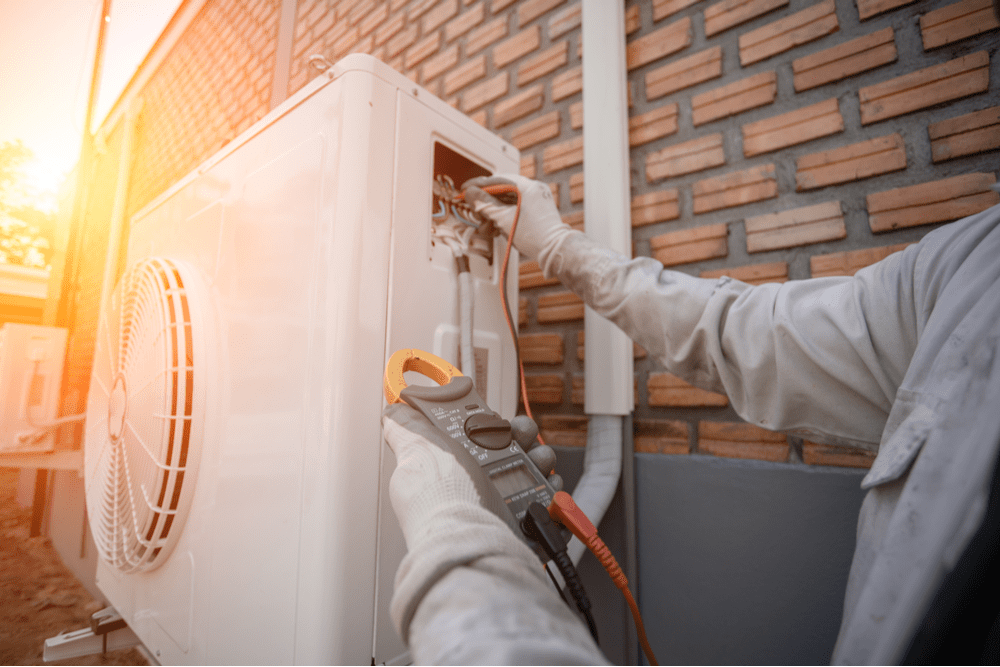
Financial Performance of an HVAC Upgrade
Heating, ventilation and air conditioning account for the largest share of energy consumption in buildings. HVAC costs are strongly dependent on climate, but you can expect them to reach 40-70% of total energy bills in commercial buildings.
Unlike solar panels and LED fixtures, which have more predictable savings, HVAC systems require a unique design for each building. MEP engineers normally use energy modeling to predict how a building will behave, and the following are some of the factors considered:
- The building envelope: The analysis considers the airtightness and insulation level of the walls, roofs and basement floors. The percentage of window area also has a major impact on thermal performance.
- HVAC equipment: Nameplate capacities and energy efficiency ratings.
- HVAC layout: The type of system also affects performance – forced air distribution, hydronic, variable refrigerant flow, etc.
- Local climate: Space heating loads increase in colder climates, while air conditioning loads increase in warmer locations.
The exact cost of a commercial air conditioning upgrade depends on many factors. According to The Builders’ Association, a chiller plant can range from $400 to $1200 per ton, while a boiler plant can range from $9 to $13 per MBH (1 MBH = 1,000 BTU/hour) . Packaged rooftop units are less expensive than chillers on average, with a cost range of $650-$900 per ton, but their energy efficiency is also lower. Geothermal heat pump systems have the highest efficiency among all HVAC technologies, but their cost can exceed $10,000 per ton.
A two-pipe HVAC system for an office building has a typical cost of $15-23 per square foot. In a 100,000-sq.ft. building, the cost would range from $1.5 to $2.3 million. Four-pipe HVAC systems are more expensive, with a cost of $23-28 per sq.ft. However, they can provide heating and cooling for different building areas simultaneously, while a two-pipe system is limited to one mode of operation for the entire building.
According to data gathered by the NYC Urban Green Council, air conditioning upgrades have a typical payback period of 5-10 years. Space heating upgrades have a quicker payback, typically below 5 years. HVAC controls can achieve a payback of less than 3 years, while building envelope upgrades may take more than 10 years to break even. The Urban Green Council also found that the most recommended measures in energy audits were lighting upgrades (80% of buildings) and HVAC controls (40% of buildings).
 https://quickelectricity.com/wp-content/uploads/2024/07/Lubbock-Electricity-Bill-Explained-scaled.jpg
1360
2048
Mary Pressler
https://quickelectricity.com/wp-content/uploads/2021/10/Quick-Electricity-Logo--300x79.jpg
Mary Pressler2024-07-21 08:55:502024-07-23 20:14:08Your Lubbock Electricity Bill Explained
https://quickelectricity.com/wp-content/uploads/2024/07/Lubbock-Electricity-Bill-Explained-scaled.jpg
1360
2048
Mary Pressler
https://quickelectricity.com/wp-content/uploads/2021/10/Quick-Electricity-Logo--300x79.jpg
Mary Pressler2024-07-21 08:55:502024-07-23 20:14:08Your Lubbock Electricity Bill Explained https://quickelectricity.com/wp-content/uploads/2024/06/Risk-of-Energy-Emergency-Alert-with-Low-Wind-Conditions-ERCOT-Grid-Summer-2024.png
371
600
Mary Pressler
https://quickelectricity.com/wp-content/uploads/2021/10/Quick-Electricity-Logo--300x79.jpg
Mary Pressler2024-06-26 09:47:422024-06-26 09:47:42Texas Electricity Outlook Summer 2024
https://quickelectricity.com/wp-content/uploads/2024/06/Risk-of-Energy-Emergency-Alert-with-Low-Wind-Conditions-ERCOT-Grid-Summer-2024.png
371
600
Mary Pressler
https://quickelectricity.com/wp-content/uploads/2021/10/Quick-Electricity-Logo--300x79.jpg
Mary Pressler2024-06-26 09:47:422024-06-26 09:47:42Texas Electricity Outlook Summer 2024 https://quickelectricity.com/wp-content/uploads/2022/08/Texas-Electricity-Broker-.png
1080
1080
Mary Pressler
https://quickelectricity.com/wp-content/uploads/2021/10/Quick-Electricity-Logo--300x79.jpg
Mary Pressler2024-06-18 16:14:522024-06-22 08:43:08Commercial Energy Broker in Texas
https://quickelectricity.com/wp-content/uploads/2022/08/Texas-Electricity-Broker-.png
1080
1080
Mary Pressler
https://quickelectricity.com/wp-content/uploads/2021/10/Quick-Electricity-Logo--300x79.jpg
Mary Pressler2024-06-18 16:14:522024-06-22 08:43:08Commercial Energy Broker in Texas https://quickelectricity.com/wp-content/uploads/2024/05/Electricity-Options-Texas.jpg
627
1200
Kelli
https://quickelectricity.com/wp-content/uploads/2021/10/Quick-Electricity-Logo--300x79.jpg
Kelli2024-05-14 04:05:352024-05-14 04:05:35Demystifying Energy Contracts: What Texans Need to Know
https://quickelectricity.com/wp-content/uploads/2024/05/Electricity-Options-Texas.jpg
627
1200
Kelli
https://quickelectricity.com/wp-content/uploads/2021/10/Quick-Electricity-Logo--300x79.jpg
Kelli2024-05-14 04:05:352024-05-14 04:05:35Demystifying Energy Contracts: What Texans Need to Know https://quickelectricity.com/wp-content/uploads/2024/04/How-to-Cut-Monthly-Expenses.jpg
412
618
Mary Pressler
https://quickelectricity.com/wp-content/uploads/2021/10/Quick-Electricity-Logo--300x79.jpg
Mary Pressler2024-04-21 16:36:072024-04-21 16:37:27How to Cut Monthly Expenses: 9 Clever Ways to Save Money
https://quickelectricity.com/wp-content/uploads/2024/04/How-to-Cut-Monthly-Expenses.jpg
412
618
Mary Pressler
https://quickelectricity.com/wp-content/uploads/2021/10/Quick-Electricity-Logo--300x79.jpg
Mary Pressler2024-04-21 16:36:072024-04-21 16:37:27How to Cut Monthly Expenses: 9 Clever Ways to Save Money https://quickelectricity.com/wp-content/uploads/2024/03/How-to-improve-energy-efficiency-in-buildings.png
980
1470
Mary Pressler
https://quickelectricity.com/wp-content/uploads/2021/10/Quick-Electricity-Logo--300x79.jpg
Mary Pressler2024-03-08 09:33:152024-03-08 09:39:41Improving Energy Efficiency in Buildings
https://quickelectricity.com/wp-content/uploads/2024/03/How-to-improve-energy-efficiency-in-buildings.png
980
1470
Mary Pressler
https://quickelectricity.com/wp-content/uploads/2021/10/Quick-Electricity-Logo--300x79.jpg
Mary Pressler2024-03-08 09:33:152024-03-08 09:39:41Improving Energy Efficiency in Buildings https://quickelectricity.com/wp-content/uploads/2024/02/Water-Conservation-and-Energy-Efficiency.jpg
788
940
Mary Pressler
https://quickelectricity.com/wp-content/uploads/2021/10/Quick-Electricity-Logo--300x79.jpg
Mary Pressler2024-02-28 08:06:552024-03-12 09:23:09An Eco-Friendly Approach to Water Conservation
https://quickelectricity.com/wp-content/uploads/2024/02/Water-Conservation-and-Energy-Efficiency.jpg
788
940
Mary Pressler
https://quickelectricity.com/wp-content/uploads/2021/10/Quick-Electricity-Logo--300x79.jpg
Mary Pressler2024-02-28 08:06:552024-03-12 09:23:09An Eco-Friendly Approach to Water Conservation https://quickelectricity.com/wp-content/uploads/2024/02/Energy-Efficient-Home-Designs-Windows-.jpg
788
940
Mary Pressler
https://quickelectricity.com/wp-content/uploads/2021/10/Quick-Electricity-Logo--300x79.jpg
Mary Pressler2024-02-08 11:39:572024-02-08 11:44:26Designing an Energy Efficient Home in 2024
https://quickelectricity.com/wp-content/uploads/2024/02/Energy-Efficient-Home-Designs-Windows-.jpg
788
940
Mary Pressler
https://quickelectricity.com/wp-content/uploads/2021/10/Quick-Electricity-Logo--300x79.jpg
Mary Pressler2024-02-08 11:39:572024-02-08 11:44:26Designing an Energy Efficient Home in 2024